Same Old Song

TNReady scores NOT ready for final grades

Well, here we go again.

The TNReady scores that are supposed to factor into a student’s final grades are NOT ready.

Districts are reporting that the testing vendor AGAIN missed the window for inclusion in final grades.

Districts have the option of waiting OR just not including them.

This happens. Every. Year.

What IS all this testing for, anyway? And if the scores aren’t back in time to be useful to districts in terms of grades, well, what’s the point?

I mean, sure, there’s the chance to hold kids back in third grade – a policy destined for failure.

The state insists on the tests. The state insists that the tests count – for grades and for retention decisions – and the state’s selected vendor consistently fails to meet agreed deadlines.

MORE TENNESSEE NEWS

TN Teacher Pay Penalty – 25%

Opposition to Arming Teachers

It May Be Ready, But is it Valid?

In today’s edition of Commissioner Candice McQueen’s Educator Update, she talks about pending legislation addressing teacher evaluation and TNReady.

Here’s what McQueen has to say about the issue:

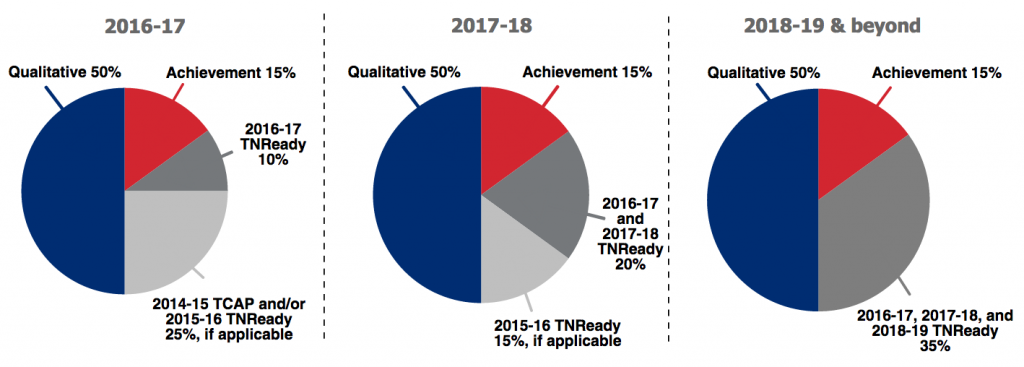
As we continue to support students and educators in the transition to TNReady, the department has proposed legislation (HB 309) that lessens the impact of state test results on students’ grades and teachers’ evaluations this year.

In 2015, the Tennessee Teaching Evaluation Enhancement Act created a phase-in of TNReady in evaluation to acknowledge the state’s move to a new assessment that is fully aligned to Tennessee state standards with new types of test questions. Under the current law, TNReady data would be weighted at 20 percent for the 2016-17 year.

However, in the spirit of the original bill, the department’s new legislation resets the phase-in of growth scores from TNReady assessments as was originally proposed in the Tennessee Teaching Evaluation Enhancement Act. Additionally, moving forward, the most recent year’s growth score will be used for a teacher’s entire growth component if such use results in a higher evaluation score for the teacher.

We will update you as this bill moves through the legislative process, and if signed into law, we will share detailed guidance that includes the specific options available for educators this year. As we announced last year, if a teacher’s 2015-16 individual growth data ever negatively impacts his or her overall evaluation, it will be excluded. Additionally, as noted above, teachers will be able to use 2016-17 growth data as 35 percent of their evaluation if it results in a higher overall level of effectiveness.

And here’s a handy graphic that describes the change:

TNReady Graphic


Of course, there’s a problem with all of this: There’s not going to be valid data to use for TVAAS. Not this year. It’s bad enough that the state is transitioning from one type of test to another. That alone would call into question the validity of any comparison used to generate a value-added score. Now, there’s a gap in the data. As you might recall, there wasn’t a complete TNReady test last year. So, to generate a TVAAS score, the state will have to compare 2014-15 data from the old TCAP tests to 2016-17 data from what we hope is a sound administration of TNReady.

We really need at least three years of data from the new test to make anything approaching a valid comparison. Or, we should start over building a data-set with this year as the baseline. Better yet, we could go the way of Hawaii and Oklahoma and just scrap the use of value-added scores altogether.

Even in the best of scenarios — a smooth transition from TCAP to TNReady — data validity was going to be challenge.

As I noted when the issue of testing transition first came up:

Here’s what Lockwood and McCaffrey (2007) had to say in the Journal of Educational Measurement:

We find that the variation in estimated effects resulting from the different mathematics achievement measures is large relative to variation resulting from choices about model specification, and that the variation within teachers across achievement measures is larger than the variation across teachers. These results suggest that conclusions about individual teachers’ performance based on value-added models can be sensitive to the ways in which student achievement is measured.
These findings align with similar findings by Martineau (2006) and Schmidt et al (2005)
You get different results depending on the type of question you’re measuring.

The researchers tested various VAM models (including the type used in TVAAS) and found that teacher effect estimates changed significantly based on both what was being measured AND how it was measured.

And they concluded:

Our results provide a clear example that caution is needed when interpreting estimated teacher effects because there is the potential for teacher performance to depend on the skills that are measured by the achievement tests.

If you measure different skills, you get different results. That decreases (or eliminates) the reliability of those results. TNReady is measuring different skills in a different format than TCAP. It’s BOTH a different type of test AND a test on different standards. Any value-added comparison between the two tests is statistically suspect, at best. In the first year, such a comparison is invalid and unreliable.

So, we’re transitioning from TCAP to TNReady AND we have a gap in years of data. That’s especially problematic — but, not problematic enough to keep the Department of Education from plowing ahead (and patting themselves on the back) with a scheme that validates a result sure to be invalid.

For more on education politics and policy in Tennessee, follow @TNEdReport


Assessment Update: Eliminating Part I, Reducing Testing Time, and Online Assessment Rollout

In an email to all Tennessee teachers, Commissioner Candice McQueen had the following updates to give regarding the upcoming year’s assessment, which includes eliminating Part I, reducing testing time, and a rollout of online assessments:

This summer we announced how we’re streamlining our assessments to provide a better testing experience for you and your students. Below are several changes to our assessment structure for the coming year.:

  • We’ve eliminated Part I. All TCAP tests will be administered in one assessment window at the end of the year, which will be April 17–May 5, 2017. High school students on block schedule will take fall EOCs November 28–December 16.
  • We’ve reduced testing time. In grades 3–8, students will have tests that are 200–210 minutes shorter than last year; in high school, most individual End of Course assessments have been shortened by 40-120 minutes.
  • We will phase in online tests over multiple years. For the upcoming school year, the state assessments for grades 3–8 will be administered via paper and pencil. However, the department will work closely with Questar, our new testing vendor, to provide an online option for high school math, ELA, and U.S. history & geography exams if both schools and the testing platform demonstrate early proof of successful online administration. Even if schools demonstrate readiness for online administration, districts will still have the option to choose paper and pencil assessments for high school students this year. Biology and chemistry End of Course exams will be administered via paper and pencil.
  • In the coming school year, the state will administer a social studies field test, rather than an operational assessment, for students in grades 3–8. This will take place during the operational testing window near the end of the year. Additionally, some students will participate in ELA and/or U.S. history field tests outside the operational testing window.

You can find more detailed information in our original email announcement (here) and in our updated FAQ (here). 

Does TCAP Measure Proficiency or Poverty?

Ken Chilton, a professor at Tennessee State University, has a column in yesterday’s Chattanooga Times-Free Press in which he theorizes that poverty is a much better predictor of student performance on TCAP than teacher performance or other school-based factors.

Moreover, Chilton argues that the current emphasis on testing is misplaced and that frequent changes in standards and tests prevent meaningful long-term trend analysis.

He says:

Despite the proclamations of systemic failure, we don’t have enough longitudinal data to really know what is or is not working. The standards and the tests used to measure success change frequently. Consequently, it’s difficult to compare apples to apples. So, when scores change in one year we tend to mistake one data point for a trend by touting success or placing blame. Yet, most of us don’t know what proficiency means.

And he laments the expectations game played by policymakers and state education leaders:

Educators are under immense pressure to show improvement. Resources, careers and jobs are on the line. But, is it realistic to expect big jumps in proficiency from one academic year to the next, to the next and to the next? No, it’s incredibly unrealistic. And, it sets up a series of public expectations that are crushed year after year.

These unmet expectations contribute to the false perception that public schools are broken and thus are undeserving of additional tax revenues.

As for education reforms that get much attention in our state, Chilton says:

…but the annual TCAP gnashing of the teeth suggests that our expectations are out of whack with reality. None of the education reforms implemented in Tennessee address the underlying root causes that threaten the viability of our public schools — inequality.

Chilton’s analysis and claims regarding inequality and the impact of poverty are supported by (admittedly short-term) analysis of TCAP data from the top- and bottom-performing districts in the state:

An analysis of TCAP performance over time indicates that those school systems with consistently high levels of poverty tend to have consistently low scores on TCAP. Likewise, those systems with the least amount of poverty tend to have consistently higher scores on TCAP.

Additional analysis suggests:

The top 10 districts spend an average of 3 times more than the bottom 10 in terms of investment over the BEP formula. They also have an ACT average that is 5 points higher and a TCAP average that is nearly 20 points higher than the bottom ten.

In short, as Chilton suspects, there is a glaring inequality in terms of the educational opportunities offered Tennessee students. Add to that a growing inadequacy in terms of state investment in schools, and you have a recipe for certain failure.

For more on education politics and policy in Tennessee, follow @TNEdReport


Quickly Inflated

Jon Alfuth has a piece over at Bluff City Ed that answers the question: Did this year’s method of calculating quick scores on TCAP result in grade inflation? The short answer is yes.

The post is complete with math and graphs that explain the two different methods for calculating quick scores and the possible grade inflation that resulted this year when the TN Department of Education switched to the cubed root method.

Here’s an excerpt that explains the point difference that would be expected based on the different methods for calculation:

The cube root method yielded on average a quick score, the score that goes for a grade, of 4.46 points higher. In other words, a student scoring basic with a raw score of 30 or higher would, on average, receive an extra 4.46% on their final quick score grade, which goes on their report card. A student who scored a 70 last year could expect to receive a 74 under the new quick score calculation.

The additional points do drop as one goes up the raw score scale, however. For the average basic student grades 3-8 with a raw score between 30 and 47, they would receive an extra 5.41 extra points under the new method.

The average proficient student grades 3-8 with a raw score between 48 and 60 would get 4.32 extra points under the new method.

The average advanced student grades 3-8 with a raw score of between 61 and 67 would receive an extra 1.97 extra points under the new method.

The difference varies much more widely for below basic students, but the difference can be as much as 25 points in some cases.

In short, final grades in subjects required to factor in TCAP scores were higher this year than they have been in the past. In some cases, these “extra points” would have moved a student up a full letter grade.

Commissioner McQueen has indicated that this method will be used going forward as the state transitions to the TNReady test, starting next year. Of course, that test is entirely different from TCAP, so comparisons between the two are of limited value — at least until there are multiple years of TNReady data to use for comparative analysis.

More on Quick Scores:

A Call for Testing Transparency

That Was Quick

Quick and Confusing


For more on education politics and policy in Tennessee, follow @TNEdReport


That was Quick

The Tennessee Department of Education is out with an apology for miscommunication that caused confusion regarding this year’s standardized testing “quick scores.”

Grace Tatter over at Chalkbeat has the story, and this quote from a letter sent to Directors of schools from Assistant Commissioner Nakia Towns:

“Our goal is to communicate early and often regarding the calculation and release of student assessment data. Unfortunately, it appears the office of assessment logistics did not communicate decisions made in fall 2014 regarding the release and format of quick scores for the 2014-15 school year in a timely manner. . . . We regret this oversight, and we will continue to improve our processes such that we uphold our commitment to transparency, accuracy, and timeliness with regard to data returns, even as we experience changes in personnel.”

As Tatter notes, this is the second year in a row that release of quick scores has been a problem for the Department of Education.

Read her full story and see the complete text of the letter sent to Directors.

It remains to be seen whether the “commitment to transparency” referenced in the letter from Towns will mean that parents and teachers can see the test questions and answers after next year’s TNReady test is administered.

For more on education politics and policy in Tennessee, follow @TNEdReport

Quick and Confusing

Over at Bluff City Ed, Jon Alfuth digs into the questions surrounding this year’s release of TCAP quick scores and their correlation to student performance on the TCAP.

This year, the way quick scores were calculated in relation to raw scores was shifted so that grades 3-8 (TCAP) scores matched the EOC scores students see in high school.

One key question is why make this change in the last year of TCAP? Next year, Tennessee students will see TNReady — so, making the calculation change now doesn’t seem to serve much purpose.

Alfuth does a nice job of explaining what’s going on and why it matters. Here are some key highlights:

Lack of Communication

They (TN DOE) didn’t make it clear to teachers, parents or students that they were changing the policy, resulting in a lot of confusion and frustration over the past few days as everyone grapples with these new quick scores.

An Explanation?

From the second memo, they note that they changed to raw scores because of concerns about getting final quick scores out on time during the transition to a new test, stating that if they did it based on proficiency, it would take until the middle of the summer to make them happen.

I’d buy that…except that the Department of Education has always been able to get the quick scores out on time before. And last I checked, we weren’t transition to TNReady this year – the transition occurs next year. So why mess with the cut scores this year? Is this just a trial run, an experiment? It feels like we’re either not getting the whole story, or that if we are there is some serious faulty logic behind this decision that someone is just trying to explain away.

It’s worth noting that last year, the quick scores weren’t available on time and most districts received a waiver from including TCAP scores in student grades. I note this to say that concern about getting quick scores out on time has some merit given recent history.

To me, though, this raises the question: Why are TCAP scores factored into a student’s grades? Ostensibly, this is so 1) students take the tests seriously and 2) how a teacher assesses a student matches up with the desired proficiency levels on the appropriate standards.

Of course, quick scores are only available for tested subjects, leaving one to wonder if other subjects are less important or valuable to a student’s overall academic well-being. Or, if there’s another way to assess student learning beyond a bubble-in test or even a test with some constructed response, such as TNReady.

I’d suggest a project-based learning approach as a means of assessing what student’s have actually learned across disciplines. Shifting to project-based learning with some grade-span testing would allow for the accountability necessary to ensure children are meeting state standards while also giving students (and their teachers) a real opportunity to demonstrate the learning that has occurred over an academic year.

Trust

The Department has also opened itself to some additional criticism that it is “massaging” the scores – that is, trying to make parents happy by bringing grades up in the last year under the old testing regime. We can’t say for certain that this is the motivating factor behind this step, but in taking this step without more transparency the Department of Education has opened itself up to this charge. And there will definitely be some people who accuse the state of doing this very thing, especially given the reasons that they cited in their memo. I personally don’t ascribe any sinister motives to the state, but you have to admit that it looks a little fishy.

In fact, TC Weber is raising some important questions about the process. He notes:

If people don’t believe in the fidelity of the system, it becomes too easy to attribute outside factors to the results. In other words, they start to feel that data is being manipulated to augment an agenda that they are not privy to and not included in. I’m not saying results are being manipulated or not being manipulated when it comes to our student evaluation system, but I am saying that there seems be a growing belief that they are, and without some kind of change, that perception will only grow. I’ve always maintained that perception is nine-tenths of reality.

As both Alfuth and Weber note, the central problem is lack of communication and transparency. As we shift to a new testing regime with uncertain results, establishing confidence in the system and those administering it is critical. After last year’s late score debacle and this year’s quick score confusion, establishing that trust will be difficult. Open communication and a transparent process can go a long way to improving perception and building support.

For more on education politics and policy in Tennessee, follow @TNEdReport

A Little Less Bad

From a story in Chalkbeat:

Tennessee’s teacher evaluation system is more accurate than ever in measuring teacher quality…

That’s the conclusion drawn from a report on the state’s teacher evaluation system conducted by the State Department of Education.

The idea is that the system is improving.

Here’s the evidence the report uses to justify the claim of an improving evaluation system:

1) Teacher observation scores now more closely align with teacher TVAAS scores — TVAAS is the value-added modeling system used to determine a teacher’s impact on student growth

2) More teachers in untested subjects are now being evaluated using the portfolio system rather than TVAAS data from students they never taught

On the second item, I’d note that previously, 3 districts were using the a portfolio model and now 11 districts use it. This model allows related-arts teachers and those in other untested subjects to present a portfolio of student work to demonstrate that teacher’s impact on growth. The model is generally applauded by teachers who have a chance to use it.

However, there are 141 districts in Tennessee and 11 use this model. Part of the reason is the time it takes to assess portfolios well and another reason is the cost associated with having trained evaluators assess the portfolios. Since the state has not (yet) provided funding for the use of portfolios, it’s no surprise more districts haven’t adopted the model. If the state wants the evaluation model to really improve (and thereby improve teaching practice), they should support districts in their efforts to provide meaningful evaluation to teachers.

A portfolio system could work well for all teachers, by the way. The state could move to a system of project-based learning and thus provide a rich source of material for both evaluating student mastery of concepts AND teacher ability to impact student learning.

On to the issue of TVAAS and observation alignment. Here’s what the report noted:

Among the findings, state education leaders are touting the higher correlation between a teacher’s value-added score (TVAAS), which estimates how much teachers contribute to students’ growth on statewide assessments, and observation scores conducted primarily by administrators.

First, the purpose of using multiple measures of teacher performance is not to find perfect alignment, or even strong correlation, but to utilize multiple inputs to assess performance. Pushing for alignment suggests that the department is actually looking for a way to make TVAAS the central input driving teacher evaluation.

Advocates of this approach will tell suggest that student growth can be determined accurately by TVAAS and that TVAAS is a reliable predictor of teacher performance.

I would suggest that TVAAS, like most value-added models, is not a significant differentiator of teacher performance. I’ve written before about the need for caution when using value-added data to evaluate teachers.

More recently, I wrote about the problems inherent in attempting to assign growth scores when shifting to a new testing regime, as Tennessee will do next year when it moves from TCAP to TNReady. In short, it’s not possible to assign valid growth scores when comparing two entirely different tests.  Researchers at RAND noted:

We find that the variation in estimated effects resulting from the different mathematics achievement measures is large relative to variation resulting from choices about model specification, and that the variation within teachers across achievement measures is larger than the variation across teachers. These results suggest that conclusions about individual teachers’ performance based on value-added models can be sensitive to the ways in which student achievement is measured.
These findings align with similar findings by Martineau (2006) and Schmidt et al (2005)
You get different results depending on the type of question you’re measuring.

The researchers tested various VAM models (including the type used in TVAAS) and found that teacher effect estimates changed significantly based on both what was being measured AND how it was measured. 

And they concluded:

Our results provide a clear example that caution is needed when interpreting estimated teacher effects because there is the potential for teacher performance to depend on the skills that are measured by the achievement tests.

So, even if you buy the idea that TVAAS is a significant differentiator of teacher performance, drawing meaningful conclusions from next year’s TNReady simply is not reliable.

The state is touting improvement in a flawed system that may now be a little less bad.  And because they insist on estimating growth from two different tests with differing methodologies, the growth estimates in 2016 will be unreliable at best. If they wanted to improve the system, they would take two to three years to build growth data based on TNReady — that would mean two t0 three years of NO TVAAS data in teacher evaluation.

Alternatively, the state could move to a system of project-based learning and teacher evaluation and professional development based on a Peer Assistance and Review Model. Such an approach would be both student-centered and result in giving teachers the professional respect they deserve. It also carries a price tag — but our students are worth doing the work of both reallocating existing education dollars and finding new ways to invest in our schools.

For more on education politics and policy in Tennessee, follow @TNEdReport


Validating the Invalid?

The Tennessee House of Representatives passed legislation today (HB 108) that makes changes to current practice in teacher evaluation as Tennessee transitions to its new testing regime, TNReady.

The changes adjust the percentage of a teacher’s evaluation that is dependent on TVAAS scores to 10% next year, 20% the following year, and back to the current 35% by the 2017-18 academic year.

This plan is designed to allow for a transition period to the new TNReady tests which will include constructed-response questions and be aligned to the so-called Tennessee standards which match up with the Common Core State Standards.

Here’s the problem: There is no statistically valid way to predict expected growth on a new test based on the historic results of TCAP. First, the new test has (supposedly) not been fully designed. Second, the test is in a different format. It’s both computer-based and it contains constructed-response questions. That is, students must write-out answers and/or demonstrate their work.

Since Tennessee has never had a test like this, it’s impossible to predict growth at all. Not even with 10% confidence. Not with any confidence. It is the textbook definition of comparing apples to oranges.

Clearly, legislators feel like at the very least, this is an improvement. A reasonable accommodation to teachers as our state makes a transition.

But, how is using 10% of an invalid number a good thing? Should any part of a teacher’s evaluation be made up of a number that reveals nothing at all about that teacher’s performance?

While value-added data alone is a relatively poor predictor of teacher performance, the value-added estimate used next year is especially poor because it is not at all valid.

But, don’t just take my word for it. Researchers studying the validity of value-added measures asked whether value-added gave different results depending on the type of question asked. Particularly relevant now because Tennessee is shifting to a new test with different types of questions.

Here’s what Lockwood and McCaffrey (2007) had to say in the Journal of Educational Measurement:

We find that the variation in estimated effects resulting from the different mathematics achievement measures is large relative to variation resulting from choices about model specification, and that the variation within teachers across achievement measures is larger than the variation across teachers. These results suggest that conclusions about individual teachers’ performance based on value-added models can be sensitive to the ways in which student achievement is measured.
These findings align with similar findings by Martineau (2006) and Schmidt et al (2005)
You get different results depending on the type of question you’re measuring.

The researchers tested various VAM models (including the type used in TVAAS) and found that teacher effect estimates changed significantly based on both what was being measured AND how it was measured. 

And they concluded:

Our results provide a clear example that caution is needed when interpreting estimated teacher effects because there is the potential for teacher performance to depend on the skills that are measured by the achievement tests.

If you measure different skills, you get different results. That decreases (or eliminates) the reliability of those results. TNReady is measuring different skills in a different format than TCAP. It’s BOTH a different type of test AND a test on different standards. Any value-added comparison between the two tests is statistically suspect, at best. In the first year, such a comparison is invalid and unreliable. As more years of data become available, it may be possible to make some correlation between past TCAP results and TNReady scores.

Or, if the state is determined to use growth scores (and wants to use them with accuracy), they will wait several years and build completely new growth models based on TNReady alone. At least three years of data would be needed in order to build such a model.

It seems likely that the Senate will follow the House’s lead on Monday and overwhelmingly support the proposed evaluation changes. But in doing so, they should be asking themselves if it’s really ok to base any part of a teacher’s evaluation on numbers that reliably predict nothing.

More on Value-Added:

Real World Harms of Value-Added Data

Struggles with Value-Added Data


Ready to Grade?

Measurement, Inc. has been hired by the State of Tennessee to design new standardized tests to replace TCAP. The new test is to be aligned to Tennessee’s new standards and will include constructed-response questions in addition to multiple choice. This means students will write answers or demonstrate work as part of the test. The idea is to demonstrate understanding of a subject, rather than simply guessing on a multiple choice test. Typically, grading a constructed response test is costly, because evaluators have to read and consider the answers and then rate them based on a rubric. Fortunately for Tennessee taxpayers, Measurement, Inc. has found a way to keep these costs low.

Here’s an ad from Measurement seeking Evaluators/Readers for tests:

Thank you for your interest in employment with Measurement Incorporated. We are a diverse company engaged in educational research, test development, and the scoring of tests administered throughout the world. Our company has grown to be the largest of its kind by providing consistent and reliable results to our clients. We are able to do so through the efforts of a professional and flexible staff, and we welcome your interest in becoming a member. Measurement Incorporated Reader/Evaluator Position Recruiting for projects starting in March of 2015 for both day and evening shift at the Ypsilanti Scoring Center. If you qualify as a reader/evaluator, you will be eligible to work on a number of our projects. Many projects require readers to score essays for content, organization, grammatical convention, and/or the student’s ability to communicate and to respond to a specific directive. Other projects involve scoring test items in reading, math, science, social studies, or other subject areas. The tests you will score come from many different states and from students at all grade levels, elementary through college, depending on the project.

LOCATION Measurement Incorporated Ypsilanti Scoring Center 1057 Emerick Ypsilanti, MI 48198 (734) 544-7686

REQUIREMENTS Bachelor’s degree in any field Ability to perform adequately on a placement assessment Completion of a successful interview Access to a home computer with high speed internet in a secure work area for telecommuters

HOURS Readers are hired on a temporary basis by project but are expected to work five days per week, Monday through Friday. Hours vary by shift. Attendance during training (usually the first few days of a project) is mandatory. PAY The starting pay is $10.70 per hour. After successful completion of three major scoring projects (or a minimum of 450 hours), readers who meet the minimum standards of production, accuracy and attendance will receive an increase to $11.45 per hour.

APPLICATION PROCEDURE To apply, please go to http://www.measurementinc.com/Employment/ and select the Reader/Evaluator position. Select Ypsilanti as your location and click on the “Apply Online” tab. Qualified applicants will be contacted to complete an online placement assessment, schedule an interview, and provide proof of degree. If invited to work on a scoring project, proof of employment eligibility in order to complete a federal I-9 from will be required within three days of employment.

Apparently, scorers at the Nashville scoring center can earn starting pay of $11.20 an hour.


Certainly, quality scorers for TNReady can be found for $10.70-$11.20 an hour via ads posted on Craigslist. I’m sure parents in the state are happy to know this may be the pool of scorers determining their child’s test score. And teachers, whose evaluations are based on growth estimates from these tests, are also sure to be encouraged by the validity of results obtained in this fashion. So, if you have a Bachelor’s degree and want to make around $11 an hour on a temporary, contract basis by all means, get in touch with the developers of Tennessee’s new standardized tests. For more on education politics and policy in Tennessee, follow @TNEdReport