Growth, Change, and Education Politics

Tennessee State University Professor and Williamson County resident Ken Chilton offers his thoughts on the changing demographic landscape of Williamson County and the implications for politics and public education there.

According to the U.S. Census Bureau, the city of Franklin was the eighth fastest growing small town in the United States between July 1, 2016 and July 1, 2017. That’s both exciting and scary. How will we pay for the schools? What about the congestion? How will we finance and manage all this growth? This is nothing new. Think of Levittown or the suburb you grew up in. Things change. Cities grow. Infrastructure gets built.

The growth of Franklin is dwarfed in number by the growth of Williamson County. The population of Williamson County grew by about 31,383 residents between 2010 and 2016. In 2016 alone, roughly 9,500 new residents moved to Williamson County from out-of-state or abroad.

Who are these new residents? Overall, 85.6 percent of Williamson County residents are classified as non-Hispanic white. In fact, between 2010 and 2016 the non-Hispanic white population grew by 24,000. Many of them have relocated to the Nashville region for employment and they chose Williamson County because of the public schools.

During that same time, the number classified as Asian grew from 4,432 to 7,752—a 75 percent increase in just 6 years. Likewise, the Hispanic population grew from 7,338 to 9,513. The African American population increased from 7,416 to 8,698, but its share of the population dropped from 4.3% in 2010 to 4.2% in 2016.

I believe Williamson County leaders and residents will figure out the growth puzzle. The bigger challenge is the ongoing demographic shifts and the future battles associated with rapid cultural change.

The Politics of Cultural Change

During the May primaries, some candidates appealed to traditional Williamson County values to garner votes. Such calls to nostalgia are often nothing more than dog whistles to a more racially homogeneous time. Regardless, there seems to be a growing resentment of newcomers. The new residents are accused of ruining the small town vibe, and presumably, bringing their non-Williamson County values.

Perhaps the opposition is not appealing to our basest instincts. Maybe it’s simply a matter of scale—we’ve reached a tipping point where the marginal costs of additional growth outweigh the marginal benefits of continued growth.

Invoking the “costs of growth” to rail against changes occurring in Williamson County is politically acceptable. However, do those who vocally oppose growth support policies typically associated with controlling growth?

Smarter growth means support for affordable housing. It means support for denser developments. It means support for impact fees. And, it means limiting the property rights of landowners who want to sell their properties to developers.

Most of the anti-government types in Williamson County resist all or most smart growth measures as big government interference in the private market.

Given this disconnect, I fear that some of the opposition to newcomers is rooted in “otherness.”

The changes are visibly evident. Go to Crockett Park on a Saturday morning and you will see plenty of racial diversity in YMCA sports leagues. My son’s YMCA tennis classes are racially diverse. A casual ride through Cool Springs reveals an increase in the number of Indian and other ethnic restaurants.

Many of the new residents are, first and foremost, parents seeking to maximize their children’s success. They might be Republicans, Democrats, or Independents in political affiliation, but their primary concern is maintaining and improving the quality of public schools. Some have moved here from high tax districts and they are fully supportive of efforts to increase public school revenues.

A quick glance at the age composition of Williamson County by racial group is instructive. Roughly 42.5% of the white population is aged 45 and older compared to 39.3% for African Americans, 21.1% for Hispanics, and 26.5% for Asians. The graying of Williamson County is most pronounced in the white community. In most cases, those over the age of 45 have less of a vested interest in the school system. Many no longer have children in the school system. Consequently, increasing property taxes to increase school revenues is a harder sell.

Age White Black Hispanic Asian
<18 26.9 27.4 38.9 31.6
18-44 30.6 33.2 39.9 41.8
45-64 30 28.2 19.1 21.5
65+ 12.5 11.1 2.0 5.1


Sharing Power & Resources

Williamson County must reconcile the concerns of an aging, mostly white, political elite that has called the shots in Williamson County for the past 30 years with the different preferences of new Williamson County residents. The May primary results are an example of how new voices are shaping local politics.

If opposition to growth is justified on the grounds that urban values are supplanting rural values, that’s xenophobia. No group has a monopoly on place. Neighborhoods transform. New residents bring fresh ideas to the public sphere. My property did not come with a deed restriction requiring me to support the political status quo.

Growth will continue to happen. You can either manage it or drown in it. You can either resent the newcomers or tear down walls and welcome them. The future is unwritten.


For more on education politics and policy in Tennessee, follow @TNEdReport

Got a story idea? Let me know at andy@tnedreport.com


Got Mine, Want More

Members of the Williamson County Commission’s Education Committee voted unanimously Monday night in favor of a resolution supporting changes in the state’s BEP formula that would direct additional state resources to the wealthiest county in the state. Williamson County is also the 7th wealthiest county in the United States.

The Williamson Herald reports:

Members of the Williamson County Commission’s education committee voted unanimously Monday night to approve a resolution of support for state legislation that would modify the Basic Education Program (BEP) to provide Williamson County and others a more reasonable allotment of state funding for education.

I suppose “reasonable allotment” is in the eye of the beholder.

The state’s funding formula for schools, the BEP, is designed to provide all districts a base level of funding to support public education. The formula came about in response to a successful lawsuit by small, rural districts who sued suggesting the way the state was funding schools was unequal. In 1992, the General Assembly enacted the Education Improvement Act which included the Basic Education Plan (BEP) as a new school funding formula. One of the primary goals of this formula was (and still is) equity.

What the legislation sponsored by Jack Johnson would do is direct additional state resources to the five school districts in the state with the greatest ability to pay.

While the BEP certainly has shortcomings, I would suggest finding ways to direct more state funds to a county quite capable (but unwilling) to dedicate local resources to schools is not a very responsible use of state taxpayer dollars. To be clear, improving the BEP by making formula adjustments (adding a component for RTI, for example), would necessarily mean additional funds going to Williamson County.

Here are some fun facts about the county now begging the state for more cash:

Williamson County has the lowest property tax rate of any county in Middle Tennessee.

Williamson County has the lowest property tax rate of any county in Tennessee with a population over 100,000.

Williamson County is the wealthiest county in the state of Tennessee and 7th wealthiest in the United States.

Williamson County Commissioners have been reluctant to raise property taxes in order to continue to provide resources to schools.

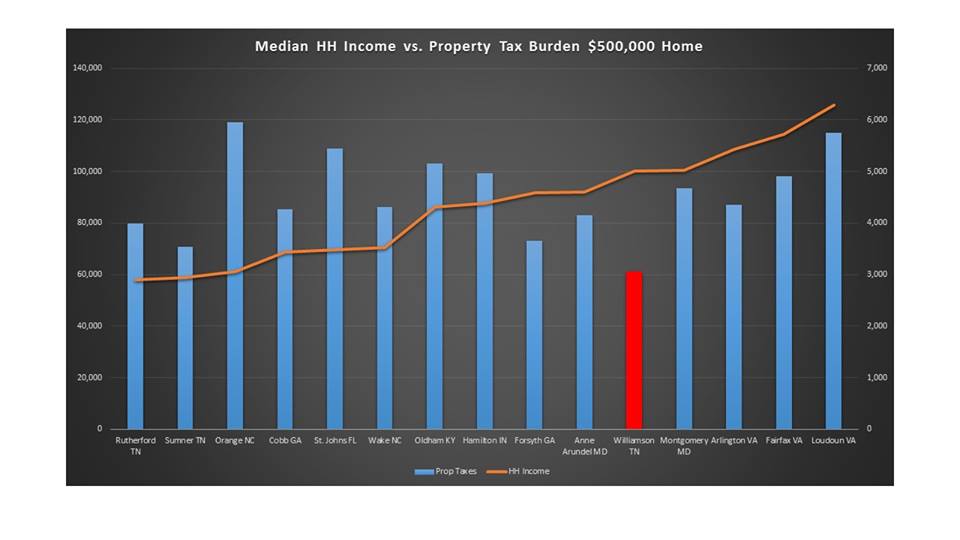
An analysis of household income compared to property tax rates in similar affluent communities reveals that Williamson County’s tax burden is incredibly low. The chart below comes from public policy professor Ken Chilton, who teaches at Tennessee State:

That red bar on the chart is Williamson County, with a property tax burden on a $500,000 home of just over $3000. That’s just over 3% of the average household income, far lower than similar communities in Tennessee and across the country. Plus, as Chilton notes, Tennesseans pay no personal income tax.

Despite these facts, Williamson County Commissioners are headed to the state with their hands out, begging for more help.

Tennessee is a state making long overdue improvements in public education. As more state dollars become available, those dollars should absolutely be invested in continuing to improve our public schools. By closing the teacher pay gap, for example.

Giving money to those districts that have the ability to generate funds on their own but won’t is not a pressing need in our state. In fact, doing so would only serve to exacerbate the inequity the BEP was intended to address. Of course, these Williamson County Commissioners aren’t concerned about inequity. They are clearly concerned about ensuring one of America’s wealthiest communities continues to pay bargain basement prices for its public schools.

Policymakers should reject this rich get richer scheme and focus on education needs that will benefit every district and lift up those least able to generate funds for schools.


For more on education politics and policy in Tennessee, follow @TNEdReport


Does TCAP Measure Proficiency or Poverty?

Ken Chilton, a professor at Tennessee State University, has a column in yesterday’s Chattanooga Times-Free Press in which he theorizes that poverty is a much better predictor of student performance on TCAP than teacher performance or other school-based factors.

Moreover, Chilton argues that the current emphasis on testing is misplaced and that frequent changes in standards and tests prevent meaningful long-term trend analysis.

He says:

Despite the proclamations of systemic failure, we don’t have enough longitudinal data to really know what is or is not working. The standards and the tests used to measure success change frequently. Consequently, it’s difficult to compare apples to apples. So, when scores change in one year we tend to mistake one data point for a trend by touting success or placing blame. Yet, most of us don’t know what proficiency means.

And he laments the expectations game played by policymakers and state education leaders:

Educators are under immense pressure to show improvement. Resources, careers and jobs are on the line. But, is it realistic to expect big jumps in proficiency from one academic year to the next, to the next and to the next? No, it’s incredibly unrealistic. And, it sets up a series of public expectations that are crushed year after year.

These unmet expectations contribute to the false perception that public schools are broken and thus are undeserving of additional tax revenues.

As for education reforms that get much attention in our state, Chilton says:

…but the annual TCAP gnashing of the teeth suggests that our expectations are out of whack with reality. None of the education reforms implemented in Tennessee address the underlying root causes that threaten the viability of our public schools — inequality.

Chilton’s analysis and claims regarding inequality and the impact of poverty are supported by (admittedly short-term) analysis of TCAP data from the top- and bottom-performing districts in the state:

An analysis of TCAP performance over time indicates that those school systems with consistently high levels of poverty tend to have consistently low scores on TCAP. Likewise, those systems with the least amount of poverty tend to have consistently higher scores on TCAP.

Additional analysis suggests:

The top 10 districts spend an average of 3 times more than the bottom 10 in terms of investment over the BEP formula. They also have an ACT average that is 5 points higher and a TCAP average that is nearly 20 points higher than the bottom ten.

In short, as Chilton suspects, there is a glaring inequality in terms of the educational opportunities offered Tennessee students. Add to that a growing inadequacy in terms of state investment in schools, and you have a recipe for certain failure.

For more on education politics and policy in Tennessee, follow @TNEdReport