TCAP, Poverty, and Investment in Schools

Recently, I wrote about the Tennessee Comprehensive Assessment of Poverty, or TCAP. In that piece, I talked about how concentrated poverty combined with low investment in schools led to poor educational outcomes. I also mentioned how the broken BEP impacts districts because it is inadequate to meet the needs of Tennessee’s schools.

Now, I want to share the data I used to make those claims.

This data will show % of investment above BEP requirements, 3 year average ACT score (where applicable) and average TCAP scores.

The Top 10

District                % above BEP           3 yr ACT avg.             TCAP avg.

FSSD                   44.94%                     n/a                                63

Rogersville         19.83%                     n/a                                60

Newport             14.51%                      n/a                                62

Maryville            33.8%                      23.8                               65

Oak Ridge          37.23%                    23.1                               58

Williamson       20.5%                       22.9                             67

Greeneville      27.47%                      22.1                             58

Johnson City  26.77%                       22.1                             61

Kingsport        31.85%                       22                               59

Shelby              17.32%                       20.8                           58

AVERAGE    27.42%                    22.4                         61.1

The Top 10 districts in terms of student achievement invested nearly 28% above the BEP requirements and had an ACT average well above the state average.

The Bottom Ten

District          % above BEP          3 yr. ACT avg.              TCAP avg.

Lake                5.07%                       18.1                                 41

Union             4.91%                       17.9                                 45

Madison         14.22%                    17.9                                 46

Campbell       3.4%                        17.7                                  44

Haywood       6.48%                     17.5                                  41

Hardeman    11.58%                    17                                      46

Hancock       4.49%                     16.6                                   44

Memphis      19.15%                   16.4                                    38

Fayette         9.83%                    16.3                                     42

Humboldt   13.5%                     16.2                                    43

AVERAGE 9.26%                 17.16                                43

The bottom ten districts in terms of student performance invest less than 10% above the BEP formula and have an ACT average well below the state average.

The top 10 districts spend an average of 3 times more than the bottom 10 in terms of investment over the BEP formula. They also have an ACT average that is 5 points higher and a TCAP average that is nearly 20 points higher than the bottom ten.

Interestingly, even the bottom 10 districts spend just over 9% more than the BEP formula on average. That’s a sure sign that districts can’t run on the funds and funding levels established by the current BEP. The BEP is simply inadequate to meet Tennessee’s educational needs.

For more on education politics and policy in Tennessee, follow @TNEdReport
The TN Poverty Test

TCAP is Tennessee’s standardized test for grades 3-8.  At least until next year, when it is replaced with something designed by Measurement, Inc. that meets new Tennessee Standards.

TCAP stand for Tennessee Comprehensive Assessment Program.  But, it could just as easily stand for Tennessee Comprehensive Assessment of Poverty.

Here’s why:

An analysis of TCAP performance over time indicates that those school systems with consistently high levels of poverty tend to have consistently low scores on TCAP. Likewise, those systems with the least amount of poverty tend to have consistently higher scores on TCAP.

Much attention was focused on Tennessee and our “rapid gains” on the NAEP. Less celebrated by state officials was the attendant expansion of the achievement gap between rich and poor students.

One possible explanation for the expanding achievement gap is the investment gap among districts. That is, those districts with lower levels of poverty (the ones scoring higher on TCAP) also tend to invest funds in their schools well above what the state funding formula (BEP) generates. The top ten districts on TCAP performance spend 20% or more above what the BEP formula generates. By contrast, the bottom 10 districts spend 5% or less above the formula dollars.

It’s no accident that the districts that spend more are those with less poverty while the districts with less investment above the BEP have higher poverty levels. And, I’ve written recently about the flaws in the present BEP system that signal it is well past time to reform the formula and increase investment.

Of further interest is an analysis of 3-year ACT averages. Here again, 9 of the top 10 districts on ACT performance spend well above the state average in per pupil spending. The top 10 districts in ACT average spend an average of $900 more per student than the state’s average per pupil expenditure.

And, on ACT scores again, those districts with the highest poverty rates make the least investment above BEP dollars and typically see results below the state average ACT score.

While Tennessee may be moving to a new test in 2016, it’s not clear yet whether that test will do more than identify the poverty level and education investment of the state’s school districts.

For more on education politics and policy in Tennessee, follow @TNEdReport

TCAP Results Show Growth

After a delay in releasing TCAP “quick scores” that led to TCAP results not being included in final grades for students in a number of Tennessee school districts, the results are finally in and they look positive.

The Department of Education Reports:

  • While  it was a year of transition for Tennessee teachers and students as they fully  implemented the state’s new standards in math and English, scores increased on the majority of  assessments.
  • Nearly 50  percent of Algebra II students are on grade level, up from 31 percent in 2011. More than 13,000 additional Tennessee  students are on grade level in Algebra II than when we first administered the  test in 2011.
  • High school English scores grew  considerably over last year’s results in English I and English II.
  • Achievement gaps for minority students narrowed  in math and reading at both the 3-8 and high school levels.
  • Approximately  100,000 additional Tennessee students are on  grade level in math compared to 2010.
  • More than 57,000 additional Tennessee students are on grade  level in science compared to 2010.

In response to the release of the results, JC Bowman, Executive Director of Professional Educators of Tennessee (PET) issued the following press release:

Data from TCAP should continue to be analyzed and evaluated. It is unclear from a cursory glance of results exactly what this means to Tennessee educators.
 
We are pleased to see the gains in High School Math. That is a good sign. We must sustain that effort, and it bodes well for STEM programs in our state.
 
“It is clear we need to carefully consider the consequences of making a one-time standardized test the be-all, end-all for our students and educators” according to JC Bowman, Executive Director.  
 
He added, “some evidence suggests improvements in student performance. But credit should also be given to school district policies and programs, as well as to educators focused on test-based accountability.”
 
“While performance is improving, the contribution of high-stakes testing to that effort remains unclear. It is critical we use data to improve instruction — but the verdict on the value of assessments this year is mixed” Bowman stated.
 
He concluded: “This year data provides general information about student performance, but lacks the nuance to provide any real instructional guidance for educators. Most educators believe TCAP or any state assessment should be used as a diagnostic tool, rather than as a punitive measure.” 

Bowman echoes the concern of many educators when he urges caution regarding how the scores are used in the teacher evaluation process.

Additionally, Bowman has written recently about a possible moratorium on the use of testing data in teacher evaluations during the transition to Common Core-aligned tests.

Similarly, new Tennessee Education Association (TEA) President Barbara Gray lamented the over-reliance on standardized testing in a recent interview.

Finally, there’s the experiment of Performance-Based Assessment in at least one Kentucky school district. It’s an experiment set to expand and some are suggesting replacing standardized tests with performance-based assessment.

As Tennessee transitions to Common Core and puts out a bid for a test to assess the standards, now is a critical time to consider the type and frequency of testing in Tennessee and also to have a conversation about how that data is used for both teachers and students.


For more on education politics and policy in Tennessee, follow @TNEdReport

TEA Takes on Huffman Over TCAP Delay

The Tennessee Department of Education advised school district directors yesterday that TCAP “quick scores” would not be available this year in time to factor them in to final grades for students in grades 3-8. This left districts with a choice: delay the issuing of report cards until the scores are available “sometime this month” OR seek a waiver from state law mandating that TCAP scores count toward a student’s final grade.

Some districts issued statements explaining what the delay means for students.

And now, TEA is out with a statement on the matter.  From the TEA press release:

The Tennessee Department of Education informed directors of schools that TCAP scores will not be available before the end of the school year, as is typically the case for calculation of students’ final grades. The state’s decision to delay the release of the scores has serious implications for students, families, teachers and administrators statewide.

“This delay is unacceptable and further illustrates the many consequences of making a one-time standardized test the be-all, end-all for our students and teachers,” said Gera Summerford, TEA president and Sevier County math teacher. “School districts being unable to calculate final grades creates a domino effect of problems for everyone from the local director of schools right down to the students.”

“Test-related anxiety and distrust are already high among students, parents and educators in our state because of Commissioner Huffman’s insistence on placing more and more weight on these tests,” Summerford continued. “The state cites a change in assessments this school year as the reason for the delay. Why are districts just now being informed about something that the department has known about for months?”

“If TCAP was used as a diagnostic tool, rather than as a punitive measure, our schools would not be in the absurd position of deciding whether to send students home without report cards or send home grades that may change once the state chooses to release the scores,” the TEA president said.

“Teachers face a tremendous challenge in providing the best education for all students, particularly when forced to spend so much time focused on standardized tests. The mishandling of this entire situation should be enough to cause legislators and communities to reevaluate, and correct, the ‘reform’ path the commissioner is leading our students down,” Summerford concluded.

For more on education politics and policy in Tennessee, follow us @TNEdReport


Expect more, but not too much more…

So, all the advocates of Common Core are part of the Expect More, Achieve More coalition.  I support the general principles of Common Core. The higher standards, the expectations, the value placed on critical thinking.

I’m carefully watching the implementation, however, as Tennessee’s track record of getting education right is well, missing.

That said, the State Department of Education has been talking a lot about expectations.  About being direct and honest with students and families about their achievement.  About what it takes to demonstrate content mastery.  About grade level appropriate learning progress.

All of which sounds good.  And, if done correctly, is good.

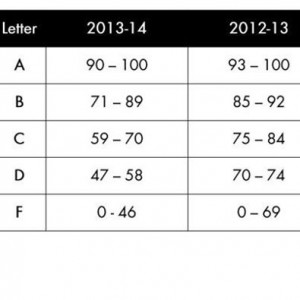
And then, I read that the Achievement School District has released a new grading scale for some of the K-8 schools in its control.

Here it is:

ASD Grades

And here’s the explanation from ASD.

Basically, they are aligning grades with TCAP cut scores.

Which means, you can receive a passing score in school and only demonstrate knowledge/mastery of 47% of content.

Also, there’s a huge range of scores for a B.

I’m not sure that if someone goes into the workforce and gets 59% of their work done well, they’ll have a job for very long.

And doesn’t this contradict the whole concept of high expectations?

And if these grades are aligned to TCAP cut scores, maybe we should strengthen the cut scores?

What about the students who “pass” their grade level with a 48? Really? Isn’t that setting them up to fail by telling them they “passed” even though they demonstrated mastery of less than half of the material?

It’s great to reward effort.  And nice to see students grow over a year.  But high expectations means high standards.

I’d expect to see stories soon about the ASD’s improved GPAs and promotion rate.

For more education policy news, follow us @TNEdReport