Not Yet TNReady?

As students and teachers prepare for this year’s standardized tests, there is more anxiety than usual due to the switch to the new TNReady testing regime. This according to a story in the Tennessean by Jason Gonzalez.

Teachers ask for “grace”

In his story, Gonzalez notes:

While teachers and students work through first-year struggles, teachers said the state will need to be understanding. At the Governor’s Teacher Cabinet meeting Thursday in Nashville, 18 educators from throughout the state told Gov. Bill Haslam and McQueen there needs to be “grace” over this year’s test.

The state has warned this year’s test scores will likely dip as it switches to a new baseline measure. TCAP scores can’t be easily compared to TNReady scores.

Despite the fact that the scores “can’t be easily compared,” the state will still use them in teacher evaluations. At the same time, the state is allowing districts to waive the requirement that the scores count toward student grades, as the TCAP and End of Course tests have in the past.

In this era of accountability, it seems odd that students would be relieved of accountability while teachers will still be held accountable.

While that may be one source of anxiety, another is that by using TNReady in the state’s TVAAS formula, the state is introducing a highly suspect means of evaluating teachers. It is, in fact, a statistically invalid approach.

As noted back in March citing an article from the Journal of Educational Measurement:

These results suggest that conclusions about individual teachers’ performance based on value-added models can be sensitive to the ways in which student achievement is measured.

The researchers tested various VAM models (including the type used in TVAAS) and found that teacher effect estimates changed significantly based on both what was being measured AND how it was measured. 


That means that the shift to TNReady will change the way TVAAS estimates teacher effect. How? No one knows. We can’t know. We can’t know because the test hasn’t been administered and so we don’t have any results. Without results, we can’t compare TNReady to TCAP. And, even once we have this year’s results, we can’t fairly establish a pattern — because we will only have one year of data. What if this year’s results are an anomaly? With three or more years of results, we MAY be able to make some estimates as to how TCAP compares to TNReady and then possibly correlate those findings into teacher effect estimates. But, we could just end up compounding error rates.

Nevertheless, the state will count the TNReady results on this year’s teacher evaluations using a flawed TVAAS formula. And the percentage these results will count will grow in subsequent years, even if the confidence we have in the estimate does not. Meanwhile, students are given a reprieve…some “grace” if you will.

I’d say that’s likely to induce some anxiety.

For more on education politics and policy in Tennessee, follow @TNEdReport
Testing Time

While Tennessee teachers are raising concerns about the amount of time spent on testing and test preparation, the Department of Education is lauding the new TNReady tests as an improvement for Tennessee students.

According to an AP story:

However, the survey of nearly 37,000 teachers showed 60 percent say they spend too much time helping students prepare for statewide exams, and seven out of ten believe their students spend too much time taking exams.

“What teachers recognize is the unfortunate fact that standardized testing is the only thing valued by the state,” said Jim Wrye, assistant executive director of the Tennessee Education Association, the state’s largest teachers’ union.

“Teachers and parents know there are so many things that affect future student success that are not measured by these tests, like social and emotional skills, cooperative behaviors, and academic abilities that do not lend themselves to be measured this way.”

Despite teacher concerns, the Department of Education says the new tests will be better indicators of student performance, noting that it will be harder for students to “game” the tests. That’s because the tests will include some open-ended questions.

What they don’t mention is that the company administering the tests, Measurement, Inc., is seeking test graders on Craigslist. And, according to a recent New York Times story, graders of tests like TNReady have, “…the possibility of small bonuses if they hit daily quality and volume targets.”  The more you grade, the more you earn, in other words.

Chalkbeat summarizes the move to TNReady like this:

The state was supposed to move in 2015 to the PARCC, a Common Core-aligned assessment shared by several states, but the legislature voted in 2014 to stick to its multiple-choice TCAP test while state education leaders searched for a test similar to the PARCC but designed exclusively for Tennessee students.

Except the test is not exactly exclusive to Tennessee.  That’s because Measurement, Inc. has a contract with AIR to use test questions already in use in Utah for tests in Florida, Arizona, and Tennessee.

And, for those concerned that students already spend too much time taking standardized tests, the DOE offers this reassurance about TNReady:

The estimated time for TNReady includes 25-50 percent more time per question than on the prior TCAP for English and math. This ensures that all students have plenty of time to answer each test question, while also keeping each TNReady test short enough to fit into a school’s regular daily schedule.

According to the schedule, the first phase of testing will start in February/March and the second phase in April/May. That means the tests are not only longer, but they also start earlier and consume more instructional time.

For teachers, that means it is critical to get as much curriculum covered as possible by February. This is because teachers are evaluated in part based on TVAAS — Tennessee Value-Added Assessment System — a particularly problematic statistical formula that purports to measure teacher impact on student learning.

So, if you want Tennessee students to spend more time preparing for and taking tests that will be graded by people recruited on Craigslist and paid bonuses based on how quickly they grade, TNReady is for you. And, you’re in luck, because testing time will start earlier than ever this year.

Interestingly, the opt-out movement hasn’t gotten much traction in Tennessee yet. TNReady may be just the catalyst it needs.

For more on education politics and policy in Tennessee, follow @TNEdReport

That’s Not That Much, Really

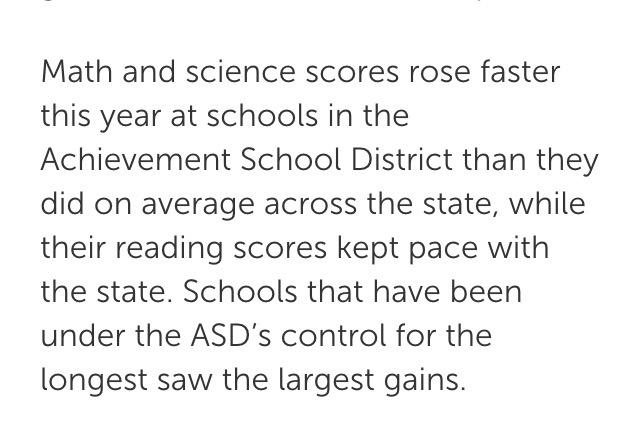
So, statewide TCAP results are out and as soon as they were released, the Achievement School District (ASD) touted its gains.

Embedded image permalink

But, what does all that mean? How are these schools doing relative to the goal of taking them from the bottom 5% of schools to the top 25% within 5 years, as founder Chris Barbic boasted before his recent revelation that educating poor kids can be difficult.

Fortunately, Gary Rubinstien has done some analysis. Here’s what he found:

By this metric the top performing ASD school from the first cohort was Corning with a score of 48.6 followed by Brick Church (47.9), Frayser (45.2), Westside (42.1), Cornerstone (37.6), and Hume (33.1).  To check where these scores ranked compared to all the Tennessee schools, I calculated this metric for all 1358 schools that had 3-8 math and reading and sorted them from high to low.

The values below represent the school’s overall score and their percentile relative to the rest of the state, in that order.

Hume 33.1 1.5%
Cornerstone 37.6 2.6%
Westside 42.1 3.2%
Frayser 45.2 4.1%
Brick Church 47.9 5.2%
Corning 48.6 5.5%

As you can see, four of the original six schools are still in the bottom 5% while the other two have now ‘catapulted’ to the bottom 6%.  Perhaps this is one reason that Chris Barbic recently announced he is resigning at the end of the year.

So, the schools that have been in the ASD the longest, making the greatest gains, are at best in the bottom 6% of all schools in the state. That’s a long, long way from the top 25.

But here’s something else. Back in December, the ASD decided to take over Neely’s Bend Middle School in Nashville. The school had been on the priority list, after all, and it was declared the victor in a school vs. school battle against Madison Middle.

I reported earlier in the week about the impressive gains at Neely’s Bend. In fact, the state’s TVAAS website shows Neely’s Bend receiving a 5 overall in its growth score — the state’s highest number.

I wondered where Neely’s Bend might fall in comparison to Rubinstein’s analysis of the ASD schools that had been under management for the past three years. Turns out, Neely’s Bend’s proficient/advanced composite for reading and is 54.4.

Yes, you read that right. Neely’s Bend’s score is 5.8 points higher than the best performing school that’s been under ASD control the longest.

Neely’s Bend is being taken over and converted to a charter school and yet the school posted significant gains (above district average), has a TVAAS overall score of 5, and has a higher percentage of students at the proficient/advanced level than the BEST schools under ASD management.

For more on education politics and policy in Tennessee, follow @TNEdReport


The Worst Teachers?

“There is a decently large percentage of teachers who are saying that they feel evaluation isn’t fair,” he (state data guru Nate Schwartz) said. “That’s something we need to think about in the process we use to evaluate teachers … and what we can do to make clear to teachers how this process works so they feel more secure about it.”

This from a story about the recently released 2015 Educator Survey regarding teacher attitudes in Tennessee.

One reason teachers might feel the evaluation is unfair is the continued push to align observation scores with TVAAS (Tennessee Value-Added Assessment System) data – data that purportedly captures student growth and thereby represents an indicator of teacher performance.

From WPLN:

Classroom observation scores calculated by principals should roughly line up with how a teacher’s students do on standardized tests. That’s what state education officials believe. But the numbers on the state’s five point scale don’t match up well.

“The gap between observation and individual growth largely exists because we see so few evaluators giving 1s or 2s on observation,” the report states.

“The goal is not perfect alignment,” Department of Education assistant commissioner Paul Fleming says, acknowledging that a teacher could be doing many of the right things at the front of the class and still not get the test results to show for it. But the two figures should be close.

In order to be better at aligning observation scores with TVAAS scores, principals could start by assigning lower scores to sixth and seventh grade teachers. At least, that’s what the findings of a study by Jessica Holloway-Libell published in June in the Teachers College Record suggest.

Holloway-Libell studied value-added scores assigned to individual schools in 10 Tennessee districts — Urban and suburban — and found:

In ELA in 2013, schools were, across the board, much more likely to receive positive value-added scores for ELA in fourth and eighth grades than in other grades (see Table 1). Simultaneously, districts struggled to yield positive value-added scores for their sixth and seventh grades in the same subject-areas. Fifth grade scores fell consistently in the middle range, while the third-grade scores varied across districts

Table 1. Percent of Schools that had Positive Value-Added Scores in English/language arts by Grade and District (2013) (Districts which had less than 25% of schools indicate positive growth are in bold)
District      Third      Fourth    Fifth     Sixth     Seventh      Eighth
Memphis      41%       43%        45%      19%        14%           76%
Nashville      NA        43%        28%      16%        15%           74%
Knox             72%       79%        47%      14%         7%            73%
Hamilton     38%      64%        48%      33%      29%            81%
Shelby           97%     76%         61%       6%        50%            69%
Sumner         77%     85%         42%       17%      33%            83%
Montgomery NA      71%         62%       0%        0%              71%
Rutherford     83%   92%         63%      15%     23%             85%
Williamson    NA      88%        58%      11%      33%           100%
Murfreesboro NA     90%        50%     30%     NA              NA

SOURCE: Teachers College Record, Date Published: June 08, 2015
http://www.tcrecord.org ID Number: 17987, Date Accessed: 7/27/2015

In examining three-year averages, Holloway-Libell found:

The three-year composite scores were similar except even more schools received positive value-added scores for the fifth and eighth grades. In fact, in each of the nine districts that had a composite score for eighth grade, at least 86% of their schools received positive value-added scores at the eighth-grade level.

By contrast, results in math were consistently positive across grade level and district type:

In particular, the fourth and seventh grade-level scores were consistently higher than those of the third, fifth, sixth, and eighth grades, which illustrated much greater variation across districts. The three-year composite scores were similar. In fact, a majority of schools across the state received positive value-added scores in mathematics across all grade levels.

So, what does this mean?

Well, it could mean that Tennessee’s 6th and 7th grade ELA teachers are the worst in the state. Or, it could mean that math teachers in Tennessee are better teachers than ELA teachers. Or, it could mean that 8th grade ELA teachers are rock stars.

Alternatively, one might suspect that the results of Holloway-Libell’s analysis suggest both grade level and subject matter bias in TVAAS.

In short, TVAAS is an unreliable predictor of teacher performance. Or, teaching 6th and 7th grade students reading is really hard.

Holloway-Libell’s findings are consistent with those of Lockwood and McCaffrey (2007) published in the Journal of Educational Measurement:

The researchers tested various VAM models and found that teacher effect estimates changed significantly based on both what was being measured AND how it was measured.

That is, it’s totally consistent with VAM to have different estimates for math and ELA teachers, for example. Math questions are often asked in a different manner than ELA questions and the assessment is covering different subject matter.

So, TVAAS is like other VAM models in this respect. Which means, as Lockwood and McCaffrey suggest, “caution is needed when interpreting estimated teacher effects” when using VAM models (like TVAAS).

In other words: TVAAS is not a reliable predictor of teacher performance.

Which begs the question: Why is the Tennessee Department of Education attempting to force correlation between observed teacher behavior and a flawed, unreliable measure of teacher performance? More importantly, why is such an unreliable measure being used to evaluate (and in some districts, reward with salary increases) teachers?

Don’t Tennessee’s students and parents deserve a teacher evaluation system that actually reveals strong teaching and provides support for teachers who need improvement?

Aren’t Tennessee’s teachers deserving of meaningful evaluation based on sound evidence instead of a system that is consistent only in its unreliability?

The American Statistical Association has said value-added models generally are unreliable as predictors of teacher performance. Now, there’s Tennessee-specific evidence that suggests strongly that TVAAS is biased, unreliable, and not effective as a predictor of teacher performance.

Unless, that is, you believe that 6th and 7th grade ELA teachers are our state’s worst.

For more on education politics and policy in Tennessee, follow @TNEdReport