After last week’s TNReady failure, the Tennessee General Assembly took some action to mitigate the impact the test would have on students and teachers.
I wrote at the time that the legislature’s action was a good step, but not quite enough:
-
The law does say that districts and schools will not receive an “A-F” score based on the results of this year’s test. It also says schools can’t be placed on the state’s priority list based on the scores. That’s good news.
-
The law gives districts the option of not counting this year’s scores in student grades. Some districts had already said they wouldn’t count the test due to the likelihood the scores would arrive late. Now, all districts can take this action if they choose.
-
The law says any score generated for teachers based on this year’s test cannot be used in employment/compensation decisions.
Here’s what the law didn’t say: There will be NO TVAAS scores for teachers this year based on this data.
In other words, this year’s TNReady test WILL factor into a teacher’s evaluation.
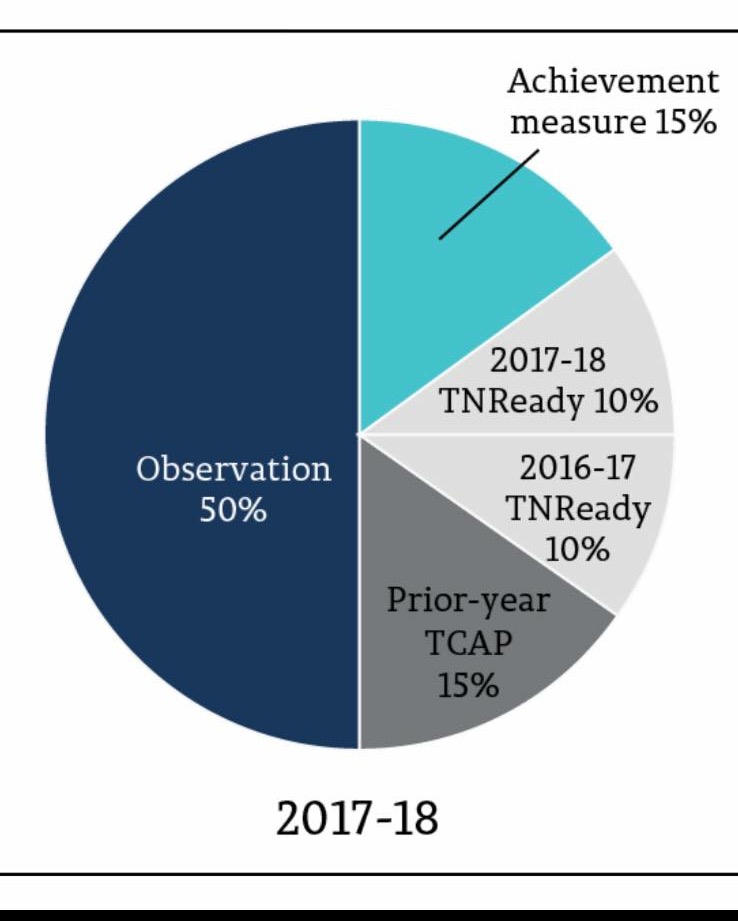
The Department of Education took some steps to clarify what that means for teachers and offered a handy pie chart to explain the evaluation process:
First, this chart makes clear that this year’s TNReady scores WILL factor into a teacher’s overall evaluation.
Second, this chart is crazy. A teacher’s growth score is factored on tests from three different years and three types of tests.
15% of the growth score comes from the old TCAP (the test given in 2014-15, b/c the 2015-16 test had some problems). Then, 10% comes from last year’s TNReady, which was given on paper and pencil. Last year was the first year of a full administration of TNReady, and there were a few problems with the data calculation. A final 10% comes from this year’s TNReady, given online.
So, you have data from the old test, a skipped year, data from last year’s test (the first time TNReady had truly been administered), and data from this year’s messed up test.
There is no way this creates any kind of valid score related to teacher performance. At all.
In fact, transitioning to a new type of test creates validity issues. The way to address that is to gather three or more years of data and then build on that.
Here’s what I noted from statisticians who study the use of value-added to assess teacher performance:
Researchers studying the validity of value-added measures asked whether value-added gave different results depending on the type of question asked. Particularly relevant now because Tennessee is shifting to a new test with different types of questions.
Here’s what Lockwood and McCaffrey (2007) had to say in the Journal of Educational Measurement:
We find that the variation in estimated effects resulting from the different mathematics achievement measures is large relative to variation resulting from choices about model specification, and that the variation within teachers across achievement measures is larger than the variation across teachers. These results suggest that conclusions about individual teachers’ performance based on value-added models can be sensitive to the ways in which student achievement is measured.These findings align with similar findings by Martineau (2006) and Schmidt et al (2005)You get different results depending on the type of question you’re measuring.The researchers tested various VAM models (including the type used in TVAAS) and found that teacher effect estimates changed significantly based on both what was being measured AND how it was measured.
And they concluded:
Our results provide a clear example that caution is needed when interpreting estimated teacher effects because there is the potential for teacher performance to depend on the skills that are measured by the achievement tests.
If you measure different skills, you get different results. That decreases (or eliminates) the reliability of those results. TNReady is measuring different skills in a different format than TCAP. It’s BOTH a different type of test AND a test on different standards. Any value-added comparison between the two tests is statistically suspect, at best. In the first year, such a comparison is invalid and unreliable. As more years of data become available, it may be possible to make some correlation between past TCAP results and TNReady scores.
I’ve written before about the shift to TNReady and any comparisons to prior tests being like comparing apples and oranges.
Here’s what the TN Department of Education’s pie chart does: It compares an apple to nothing to an orange to a banana.
Year 1: Apple (which counts 15%)
Year 2: Nothing, test was so messed up it was cancelled
Year 3: Orange – first year of TNReady (on pencil and paper)
Year 4: Banana – Online TNReady is a mess, students experience login, submission problems across the state.
From these four events, the state is suggesting that somehow, a valid score representing a teacher’s impact on student growth can be obtained. The representative from the Department of Education at today’s House Education Instruction and Programs Committee hearing said the issue was not that important, because this year’s test only counted for 10% of the overall growth score for a teacher. Some teachers disagree.
Also, look at that chart again. Too far up? Too confusing? Don’t worry, I’ve made a simpler version:
For more on education politics and policy in Tennessee, follow @TNEdReport
Your support keeps Tennessee Education Report going strong — thank you!


