Statisticians define an outlier as an observation point that is distant from other observations in a statistical analysis. Often, this occurs by chance. Additional modeling or deeper analysis (including more data, for example, or a longer range of data) can often correct for this. Outliers that are not the result of measurement error are often excluded from analysis about a data set.
Today, the 2017 results from the National Assessment of Educational Progress (NAEP) were released. This release made me think of a particular outlier.
Back in 2013, Tennessee demonstrated what some heralded as an incredible achievement on the NAEP. In fact, a press release from Governor Haslam at the time noted:
Gov. Bill Haslam today announced that Tennessee had the largest academic growth on the 2013 National Assessment of Educational Progress (NAEP) of any state, making Tennessee the fastest improving state in the nation. (emphasis added)
Those words — “fastest improving state in the nation” — have been uttered by Haslam and many political leaders in our state for years now. Often, this 2013 “success” is used as justification for “keeping our foot on the gas” and continuing an aggressive agenda of test-based accountability and teacher evaluation based on methods lacking validity.
Here’s what I wrote back in 2013 when these results were released:
Yes, Tennessee should celebrate its growth. But policymakers should use caution when seeing the results from the last 2 years as a validation of any particular policy. Long-term trends indicate that big gains are usually followed by steady maintenance. And, even with the improvement, Tennessee has a long way to go to be competitive with our peers. Additionally, education leaders should be concerned about the troubling widening of the rich/poor achievement gap – an outcome at odds with stated policy goals and the fundamental principle of equal opportunity.
Two years later, when the 2015 results were released, I noted:
This year’s scores, in which Tennessee remained steady relative to the 2013 scores suggest, if anything, that the 2013 jump was likely an outlier. Had the 2013 gains been followed by gains in 2015 and again in 2017, more could be suggested. And frankly, it is my hope that we see gains (especially in reading) in 2017. But, it’s problematic to suggest that any specific reform or set of reforms caused the one-time jump we saw in 2013. Saying we are the fastest improving state in the nation over the last 4 years when we only saw a jump in 2013 is like saying we started the first quarter of a football game way behind, scored a bunch in the second quarter, (so we’re not as far behind), and then scored the same number of points in the third quarter. The result is we’re still behind and still have a long way to go.
Fast forward to today. The leveling off I suggested was likely back in 2013 has happened. In fact, take a look at this chart put out by the Tennessee Department of Education:
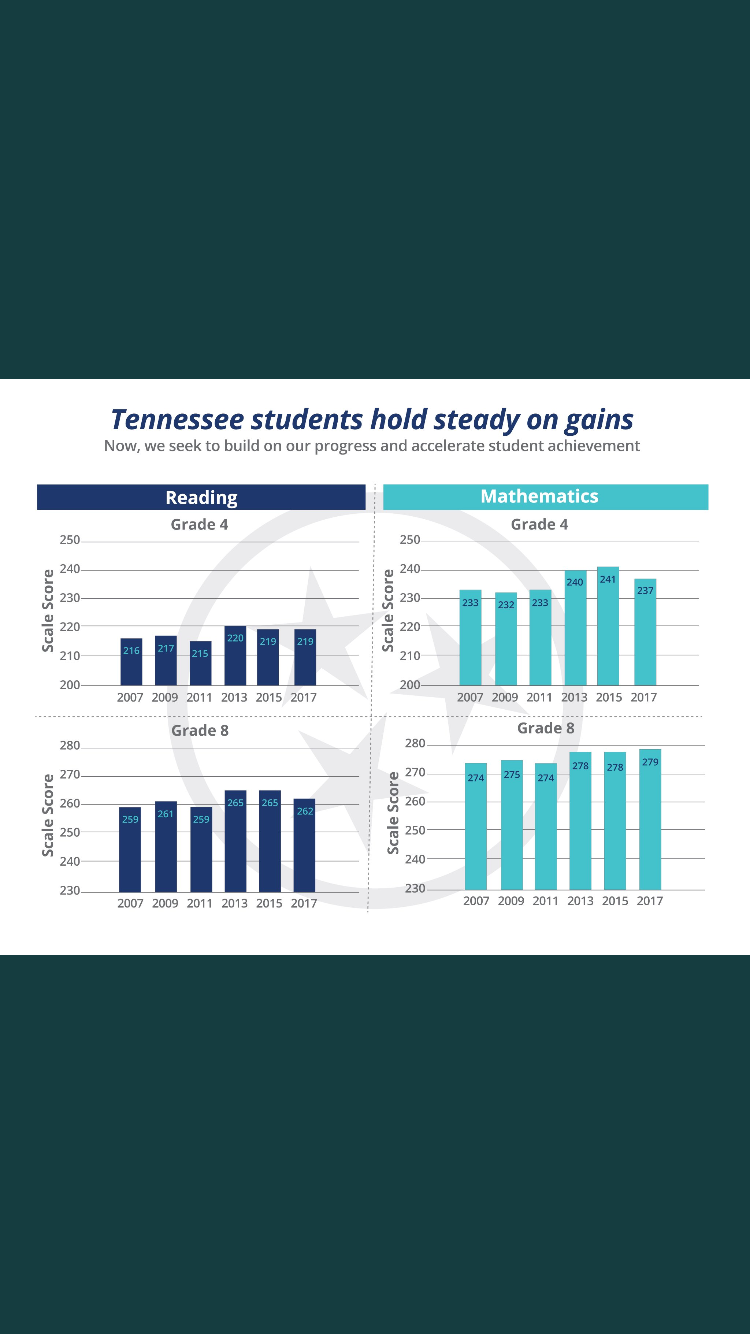
First, notice that between 2009 and 2011, Tennessee saw drops in 4th and 8th grade reading and 8th grade math. That helps explain the “big gains” seen in 2013. Next, note that in 4th and 8th grade reading and 4th grade math, our 2017 scores are lower than the 2013 scores. There’s that leveling off I suggested was likely. Finally, note that in 4th and 8th grade reading, the 2017 scores are very close to the 2009 scores. So much for “fastest-improving.”
Tennessee is four points below the national average in both 4th and 8th grade math. When it comes to reading, we are 3 points behind the national average in 4th grade and 5 points behind in 8th grade.
All of this to say: You can’t say you’re the fastest-improving state on NAEP based on one testing cycle. You also shouldn’t make long-term policy decisions based on seemingly fabulous results in one testing cycle. Since 2013, Tennessee has doubled down on reforms with what now appears to be little positive result. Instead, as Rep. Jeremy Faison said recently, our policies are “driving teachers crazy.”
Oh, and that new TNReady test has so far not been very ready.
But what about the good policy coming from this? You know, like Governor Haslam’s plan to make Tennessee the “fastest-improving state in teacher pay?”
About that:
Average teacher salaries in the United States improved by about 4% from the Haslam Promise until this year. Average teacher salaries in Tennessee improved by just under 2% over the same time period. So, since Bill Haslam promised teachers we’d be the fastest improving in teacher pay, we’ve actually been improving at a rate that’s half the national average. No, we’re not the slowest improving state in teacher pay, but we’re also not even improving at the average rate.
Surely, though, all this focus on education since the NAEP buzz has meant meaningful investment in schools, right? Well, no:
Tennessee earns a grade of F when it comes to funding effort compared to funding ability. The researchers looked at Gross State Product and Personal Income data in order to determine a state’s funding ability then looked at dollars spent per $1000 (in either GSP or Personal Income) to determine effort. Tennessee spends $29 on schools for every $1000 generated in Gross State Product. When it comes to Personal Income, Tennessee spends just $33 per $1000 of average personal income. That’s a rank of 42 in both.
Then, the report looks at wage competitiveness — how much teachers earn relative to similarly-educated professionals. I’ve written about this before, and Tennessee typically doesn’t do well in this regard.
Maybe we’ve taken a minute to get serious about investing in programs targeting struggling students? Also, no:
One possible solution would be to embed funding for school-level RTI2 specialists in the state’s funding formula for schools, the BEP. In fact, Rep. Joe Pitts offered legislation that would do just that last year. His plan would have added funding for three RTI2 specialists at each school for a total projected cost of $167 million. Commissioner McQueen was quick to shoot that idea down and came back this year with the funding proposal of $13 million, or one specialist per district. That’s only $154 million short of adopting a plan that would actually meet the needs of a program many suggest is an important way to improve educational outcomes for Tennessee students.
Maybe we are closing achievement gaps? Again, no.
Back in 2013, Tennessee students eligible for free/reduced lunch had an average NAEP reading score of 256 and scored 20 points below the non-eligible students. Now, that average score is 252 (four points worse) and 19 points below. For 4th grade, there’s a similar story, with free/reduced lunch eligible students scoring 25 points below their non-eligible peers this year. Four years ago, it was 26 points.
We’re not moving the needle. Our most vulnerable students continue to be left behind. Meanwhile, we hear nice words from top policymakers and see little actual result in terms of tangible improved investment in schools or any meaningful upgrade in teacher pay. Our testing system has yet to be proven.
Maybe now Tennessee policymakers will stop repeating the “fastest-improving” line and start doing the actual work of investing in and supporting our schools.
In any case, the next time you hear someone spout off that tired “fastest-improving” line, just yell back: OUTLIER!
For more on education politics and policy in Tennessee, follow @TNEdReport