A guest post from Ken Chilton, who teaches education policy at Tennessee State University
When organizations plan for strategic change, one tenet is to cherry pick some easy wins early in the process to build support for the program and new momentum. School districts across the state of Tennessee are doing exactly that. They are parading the recently released TVAAS data that shows big jumps in value-added achievement.
Good news should be trumpeted, but I’m not sure this is good news. Unfortunately, most people have no idea what TVAAS measures. A score of “5” out of a possible 5 sounds impressive; however, it is an extremely flawed measure of success. While TVAAS purports to measure student growth year over year, the Department of Education advises, “Growth scores should be used alongside achievement scores from TNReady to show the fuller picture of students’ performance.”
When happy education administrators state “math scores increased from 27.6% proficient or greater to 28.1%” what does this mean? How do we translate a school district’s TVAAS score or essentially meaningless *increase* in scores to your child’s performance? It simply means that on one day your child took a standardized test and was considered above/below a proficiency threshold designated by an education technocrat. It provides little information on your child’s level of achievement and/or the quality of her/his teacher.
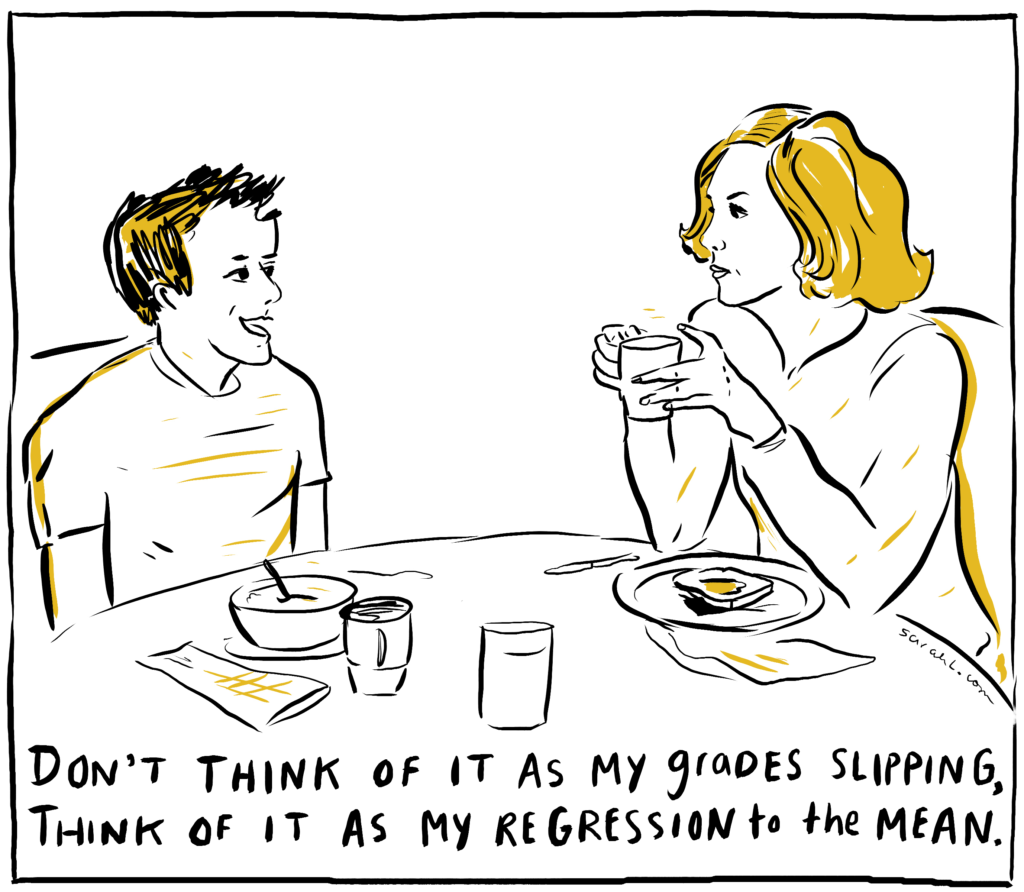
Surely, we wouldn’t spend millions of dollars annually and weeks upon weeks on preparation on a test that is meaningless, would we? Sadly, the answer is yes. In statistics, the term “regression to the mean” is used to explain how extremely low and high performers tend to move toward the average over time. If you start with really low scores, it’s easier to show large gains. Achieving a one-year jump in test scores or value-added algorithms at the school or district level does not mean your district or school is performing at a high level.
For example, let’s take two groups of kids and test them on their ability to complete 50 pushups—our chosen benchmark for measuring fitness proficiency. Let’s assume group A completed an average of 65 pushups last year. Group A participants have private trainers and nutritionists who work with them outside normal training hours. This year, Group A completes an average of 66 pushups. The trainers did not achieve much in terms of value-added.
Group B, on the other hand, has had little training. Last year, they averaged 5 pushups per participant. After concerted efforts to improve their performance, they averaged 10 pushups per participant this year. They DOUBLED their output and would likely show high value-added performance. Granted, they are still woefully below the 50-pushup benchmark.
In a nutshell, superintendents across the state are celebrating a nebulous statistic. Critics of value-added tests to measure teacher performance have long argued that state tests—especially multiple-choice ones—are woefully inadequate measures of a teacher’s impact on learning. TVAAS assumes that teacher effects can be isolated from the array of external variables that are widely recognized as factors that affect student performance. So much of learning occurs outside the school, but none of these factors are controlled for in value-added scores.
Here’s the good news: positive things are happening. Celebrate that. However, don’t mislead the public. One year of data does not make a trend—especially when the 2018 data were massively flawed. What matters is performance. Tennessee’s TN Ready test focuses solely on Tennessee standards. As such, parents cannot compare student results to other states that have different standards.
If you want to know how well Tennessee performs relative to other states, focus on the National Assessment of Education Progress (NAEP). NAEP is a good test and allows state-to-state comparison of performance using rigorous proficiency standards. It is administered every 2-years to randomly selected 4th, 8th, and 12th graders.
If you analyze NAEP data, Tennessee has not experienced sustained improvements in 4th and 8th grade reading and math tests over the last 3 testing periods. In 2017, 33 percent of Tennessee 4th graders and 31 percent of 8th graders achieved NAEP proficiency in reading. In math, 36 percent of 4th graders and 30 percent of 8th graders achieved NAEP proficiency.
The sad truth remains: most of the factors associated with student performance are related to socio-economic status. Inasmuch as poverty rates, absenteeism, parental involvement, household stability, and economic certainty are outside the control of school administrators and teachers, school performance data will underwhelm. Thus, we celebrate improvements in TVAAS algorithms that are not valid predictors of teacher performance.
For more on education politics and policy in Tennessee, follow @TNEdReport
Your support – $5 or more today — helps make publishing education news possible.