A Tennessee-based Company Wants to Help You Get Money for College

Bobby Nicholson and his company, Outlier’s Advantage, want Tennessee kids and kids nationwide to have the best possible chance to earn money to attend college. That’s why they created the It Pays to Prep guide. At first, it was a guide to merit-based scholarship criteria for Tennessee schools. Now, they’ve gone national. I asked Nicholson to tell me more about It Pays to Prep and what it means for students headed to college.

1) Tell me more about It Pays to Prep. When did it start? What information is in it? 

We published the first edition of It Pays to Prep in 2016. Many families were not aware of the guaranteed scholarship model that most colleges now use. Furthermore, most families weren’t aware of how much money was being awarded for each additional point that their student earns on the ACT. We also were trying to give our students more motivation to put in the work necessary to beat the ACT. Hence, It Pays to Prep was born. 

In its most basic form, it gives families an easy way to find their student’s GPA and ACT score and find how much money they will be awarded at different schools. We list the value per year and over four years, the tuition and fees per year at that school, and the amount remaining for families to pay per year. It also lists general information about the school. 

It Pays to Prep helps students consider a wide range of colleges that they may not have ever looked into before. It also helps families easily compare schools to each other. 

2) This has historically been a guide focused on Tennessee schools — what made you take it national? 

Our plan is to become the premier ACT prep provider for high-achieving students nationwide. No one else is compiling anything like this, especially not in the easy to read format that we do. We hope this begins to garner traffic and attention all over the nation and simultaneously spreads the word about the work we are doing at Outlier’s Advantage: ACT Prep Academy.

3) What information is in It Pays to Prep that parents can’t or won’t find from other sources?

Parents can find almost all of the information elsewhere. The benefit of It Pays to Prep is that we spend hundreds of hours finding all of this information, separating the wheat from the chaff, and compiling it all on one easy to read document. 

4) What do you see as the biggest challenge for parents and students navigating the college admissions process?

There is so much variation in what students should be doing dependent on their current situation and their goals. Most of the information available is geared towards the average college-bound student. For above-average students, unless they go to a great school, it is often very hard for them to know what they need to be doing and when. 

Here are some simple pieces of advice for students who are hoping to win merit-based scholarship money or attend a competitive school. 

    ⁃    Make sure you have at least a 3.8 weighted GPA by the end of your junior year. Big schools are usually only looking at GPAs from freshman through junior year. Students can lose their scholarship based on how they do their senior year, but students cannot gain it. This may change with everything going on because of COVID, but it is best to be safe.

    ⁃    Take the hardest classes your school offers. Competitive schools have a rating system that ranks how many of the hardest classes you took. This will also better prepare you to be successful at the college level and on your ACT. 

    ⁃    If you are in middle school or younger, set a goal to have read 100 books by the end of your sophomore year of high school. Your reading speed will be one of the biggest determining factors in how you do on standardized tests and how long homework takes in college.

    ⁃    Take your first ACT before your junior year. Most high schools offer it for the first time in the spring semester of junior year. This is great for most students. However, if you are hoping to win merit-based scholarship money, we would advise taking it as soon as you can after you complete algebra II and geometry. This gives you your sophomore summer and junior year to prep for your ACT, and it gives you your junior summer and senior fall to search for colleges and scholarships. 

    ⁃    Governor’s School applications often need to be submitted before December of your junior year. 

    ⁃    Though it has some reasonable critics, collegescorecard.ed.gov is a must-use resource for students deciding where to go to college. The two metrics that we use it for the most are the percentage of students returning after their first year and the average salary after graduation. These numbers aren’t necessarily representative of what your experience will be like, but they are good at helping to compare schools.

Here’s the latest version of the national guide.

For more on education politics and policy in Tennessee, follow @TNEdReport
How Did MNPS High Schools And Subgroups Do On The ACT?

I recently wrote about the release of ACT scores for the state and specifically for Nashville. We learned that only 11% of MNPS students were college and career ready according to the ACT. 

Today, MNPS released more in depth information on the individual high schools as well as information on specific subgroups in Nashville. 

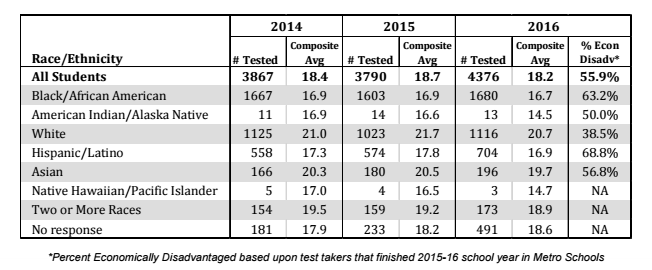
According to MNPS, 4,376 seniors took the ACT with the average score of 18.2. Seniors need to have a composite score of 21 or above to qualify for the HOPE scholarship. While the percent of high school students qualifying for HOPE scholarship decreased, the number of students qualifying for the scholarship actually increased from from 1,131 to 1,219 students.

Achievement Gap

Before we look at the scores of individual high schools, I want to look at the ACT scores based on subgroups. Below we see the gap between Black (16.7), Hispanic/Latino (16.9), and White (20.7) students. That’s a 4 point different between Black and White students and a 3.8 point difference Hispanic/Latino and White students.

screen-shot-2016-09-13-at-2-46-12-pm

How did individual high schools do?

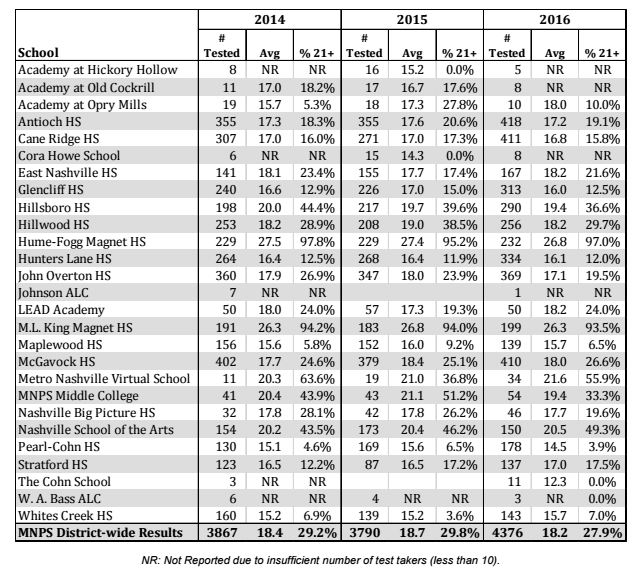
The top traditional high schools for ACT achievement are Hume-Fogg (26.8), MLK (26.3), and Nashville School of the Arts (20.5). The lowest traditional high schools are Pearl Cohn (14.5), Whites Creek (15.7), and Maplewood (15.7). Obviously, the top three schools are all magnet schools.

MNPS points out a few things about this year’s data:

Stratford tested many more students in 2016 and had an increase of 0.5 points. East Nashville, Whites Creek and Metro Nashville Virtual School saw test score increases while having modest increases in the number of test takers. LEAD Academy tested slightly fewer students but saw an increase in scores.

screen-shot-2016-09-13-at-2-51-38-pm

How do we improve?

MNPS is working with Alignment Nashville to give free ACT preparation classes to students who cannot afford them. Last year, Alignment Nashville worked with Hunters Lane, Hillsboro, Maplewood, and Overton. Additional schools may be added this year.

I am so glad that Alignment Nashville is partnering with our schools to prepare our students for the ACT. We are doing a disservice to our students who graduate from high school not prepared for college or career. It breaks my heart that thousands of students are missing out on the HOPE scholarship. More must be done to help these students, and all of that shouldn’t be left to our high school teachers.

Preparing our students for graduation starts before the students even get to the high school level. MNPS transformed our high schools years ago towards the academy model. I think it’s time to start looking at the transformation of elementary and middle schools.

Elementary and middle schools need more supports in place to help close the gaps before students move on to high school. I don’t have all the answers, but I hope MNPS will be looking into ways to give more support to our lower grades.

For more on education politics and policy in Tennessee, follow @TNEdReport.


The ACT Results Are In. How Did We Do?

Tennessee tracks if students are career and college ready by requiring all students to take the ACT. On the ACT, college and career ready is determined by a score of 21. A score of a 21 allows students to qualify for the HOPE scholarship, and students will be able to skip remedial courses in college.

How did the state do? Chalkbeat has the answer:

Tennessee held steady with an average score of 19.4 out of a possible 36, increasing its standing from eighth to seventh among the 18 states that require students to take the ACT. The national average score was 20.8, down from 21 last year.

Even so, state officials celebrated that nearly 1,300 more Tennessee public school students hit the college-ready mark this year than last.

In 2016, only one-fifth of Tennessee public school students taking the ACT met all four subject benchmarks for being considered college-ready. English drew the best showing, with about 55 percent meeting that benchmark, followed by 34 percent in reading, and 27 percent each in math and science

What about individual districts? In Nashville, only 11% of students are college and career ready. The Tennessean has the Nashville numbers:

Metro Schools tallied an 18.4 composite score, marking a 0.3 point drop over the 2015 year‘s 18.7 composite score across all students tested, according to 2016 ACT numbers released to districts Tuesday. Only 11 percent of all Metro Schools students are ready for college, a three-point dip over last year.

We must do better in preparing our students for college and career state-wide, but especially in Nashville. The average MNPS student will need remedial courses if they go to college. That means MNPS students and their families will be paying more money to take courses that may not even count towards their post secondary degree. That’s a disservice to our students.

How does MNPS with the rest of Middle Tennessee?

  • Cheatham County: 19.6 composite; 17 percent college ready
  • Dickson County: 19.4 composite; 16 percent college ready
  • Metro Nashville: 18.4 composite; 11 percent college ready
  • Robertson County: 19 composite; 14 percent college ready
  • Rutherford County: 20.2 composite; 21 percent college ready
  • Sumner County: 20.8 composite; 23 percent college ready
  • Williamson County: 23.8 composite; 45 percent college ready
  • Wilson County: 20.3 composite;  19 percent college ready

For more on education politics and policy in Tennessee, follow @TNEdReport.


Bill Dunn Wrong

Yesterday, in his advocacy for HJR 493, legislation that would remove the Tennessee Constitution’s requirement that the General Assembly adequately fund schools, State Representative Bill Dunn suggested that increasing funding for schools across the state actually does not improve student outcomes. He cited the initial BEP investment, started in 1992 and said that from beginning to end, the program actually resulted in lower student achievement numbers.

This would be a great way to prove Dunn’s case that the General Assembly need not provide additional funds to schools in order to provide an adequate education.

It’s also not true.

Dunn cited ACT scores from the start of the BEP until 1998 and suggested they’d gone down slightly. What he failed to mention is that between 1995 and 1998, the number of students taking the ACT increased by 25%. That would seem to indicate that Rep. Kevin Dunlap was correct when he suggested that new BEP funds created new opportunities for students in rural districts. As the State of Tennessee noted in the 1998 State Report Card:

The ACT is one of three tests approved by the State Board of Education to fulfill the requirement in state law that all students take an exit exam to receive a full high school diploma. The total number of Tennessee graduates taking the ACT rose 25% during the first three years of this new requirement: from 32,628 in 1995 to 40,782 in 1998. Included among those tested were 14,284 who had not completed a college preparatory course of study. Even with these dramatic increases in the number and percentage of students tested, Tennessee’s students were able to narrow the gap between the state and national composite scores in 1998.

So, more students than ever were taking the ACT and by 1998, the state was turning around an initial decline in scores. That’s a different story than the one Bill Dunn told.

Another way to look at the data is to see what happened on the National Assessment of Educational Progress (NAEP) during the early BEP years. While reading scores from 1992 are not readily available, math scores are. Here’s the comparison:

4th Grade Math

1992         211

2000        220

8th Grade Math

1992        259

2000       263

These results show statistically significant improvements in math scores over the same time period the General Assembly was significantly improving investment in public schools. That is, what Bill Dunn said yesterday was just plain wrong.

Finally, it’s worth examining the ACT score differences among districts during the early BEP years. An examination of data beginning in 1991 (the year before BEP) and ending in 2001 (so as to provide 10 years of comparable data) indicates that the top scoring districts in the state on the ACT were also among the top spending districts. In fact, over those years, while not technically statistically significant, it can be said with 92% confidence that the difference in ACT scores among the highest- and lowest-performing districts is explained by per pupil expenditures. That is, the higher the spending, the more likely the district is to be among the state’s top performers on the ACT.

Additionally, during this same ten year time period, the gap between the highest and lowest scores among districts is clearly explained by the gap in per pupil expenditures among those districts. You spend more, you get better results. The impetus for all this spending was the new BEP formula that sent more money to all school systems. Those districts already at the top were most able to take advantage and boost ACT scores while those at the bottom saw an increase in the number of students taking the ACT, resulting in the statewide slight ACT decline Dunn references.

Investing in schools matters. Our state’s constitution requires the General Assembly to provide a system of free public schools, including providing adequate funding for those schools. Bill Dunn doesn’t think spending levels matter. The data suggests otherwise.

For more on education politics and policy in Tennessee, follow @TNEdReport

TCAP, Poverty, and Investment in Schools

Recently, I wrote about the Tennessee Comprehensive Assessment of Poverty, or TCAP. In that piece, I talked about how concentrated poverty combined with low investment in schools led to poor educational outcomes. I also mentioned how the broken BEP impacts districts because it is inadequate to meet the needs of Tennessee’s schools.

Now, I want to share the data I used to make those claims.

This data will show % of investment above BEP requirements, 3 year average ACT score (where applicable) and average TCAP scores.

The Top 10

District                % above BEP           3 yr ACT avg.             TCAP avg.

FSSD                   44.94%                     n/a                                63

Rogersville         19.83%                     n/a                                60

Newport             14.51%                      n/a                                62

Maryville            33.8%                      23.8                               65

Oak Ridge          37.23%                    23.1                               58

Williamson       20.5%                       22.9                             67

Greeneville      27.47%                      22.1                             58

Johnson City  26.77%                       22.1                             61

Kingsport        31.85%                       22                               59

Shelby              17.32%                       20.8                           58

AVERAGE    27.42%                    22.4                         61.1

The Top 10 districts in terms of student achievement invested nearly 28% above the BEP requirements and had an ACT average well above the state average.

The Bottom Ten

District          % above BEP          3 yr. ACT avg.              TCAP avg.

Lake                5.07%                       18.1                                 41

Union             4.91%                       17.9                                 45

Madison         14.22%                    17.9                                 46

Campbell       3.4%                        17.7                                  44

Haywood       6.48%                     17.5                                  41

Hardeman    11.58%                    17                                      46

Hancock       4.49%                     16.6                                   44

Memphis      19.15%                   16.4                                    38

Fayette         9.83%                    16.3                                     42

Humboldt   13.5%                     16.2                                    43

AVERAGE 9.26%                 17.16                                43

The bottom ten districts in terms of student performance invest less than 10% above the BEP formula and have an ACT average well below the state average.

The top 10 districts spend an average of 3 times more than the bottom 10 in terms of investment over the BEP formula. They also have an ACT average that is 5 points higher and a TCAP average that is nearly 20 points higher than the bottom ten.

Interestingly, even the bottom 10 districts spend just over 9% more than the BEP formula on average. That’s a sure sign that districts can’t run on the funds and funding levels established by the current BEP. The BEP is simply inadequate to meet Tennessee’s educational needs.

For more on education politics and policy in Tennessee, follow @TNEdReport

The TN Poverty Test

TCAP is Tennessee’s standardized test for grades 3-8.  At least until next year, when it is replaced with something designed by Measurement, Inc. that meets new Tennessee Standards.

TCAP stand for Tennessee Comprehensive Assessment Program.  But, it could just as easily stand for Tennessee Comprehensive Assessment of Poverty.

Here’s why:

An analysis of TCAP performance over time indicates that those school systems with consistently high levels of poverty tend to have consistently low scores on TCAP. Likewise, those systems with the least amount of poverty tend to have consistently higher scores on TCAP.

Much attention was focused on Tennessee and our “rapid gains” on the NAEP. Less celebrated by state officials was the attendant expansion of the achievement gap between rich and poor students.

One possible explanation for the expanding achievement gap is the investment gap among districts. That is, those districts with lower levels of poverty (the ones scoring higher on TCAP) also tend to invest funds in their schools well above what the state funding formula (BEP) generates. The top ten districts on TCAP performance spend 20% or more above what the BEP formula generates. By contrast, the bottom 10 districts spend 5% or less above the formula dollars.

It’s no accident that the districts that spend more are those with less poverty while the districts with less investment above the BEP have higher poverty levels. And, I’ve written recently about the flaws in the present BEP system that signal it is well past time to reform the formula and increase investment.

Of further interest is an analysis of 3-year ACT averages. Here again, 9 of the top 10 districts on ACT performance spend well above the state average in per pupil spending. The top 10 districts in ACT average spend an average of $900 more per student than the state’s average per pupil expenditure.

And, on ACT scores again, those districts with the highest poverty rates make the least investment above BEP dollars and typically see results below the state average ACT score.

While Tennessee may be moving to a new test in 2016, it’s not clear yet whether that test will do more than identify the poverty level and education investment of the state’s school districts.

For more on education politics and policy in Tennessee, follow @TNEdReport

Thoughts on PARCC and Other Tests


This article was written by JC Bowman, Executive Director of Professional Educators of Tennessee. The article notes that the road ahead for PARCC and for other Common Core connected assessments is complex and requires careful navigation.

There has been a renewed focus on the role of testing across the United States. This has opened a new dialogue among stakeholders, as well as policymakers. It is clear that new policies are needed to reflect the changing landscape in education and maximize changes in technology. As assessments will also be changing, data protection is a must. The ancillary debate is “Should the state bear the expense of testing, or is it a local responsibility?”


The debate is not merely about the pending and still experimental PARCC or Smarter Balanced Assessments. In fact, there will be probably 10 to 15 less expensive assessment options under consideration. Additionally, there are the assessments of the states that are not Common Core State Standard members, for a total of about 20 possible assessments designed to measure a common set of standards. Some of these options may become a necessity if a “Plan B” is needed in case the PARCC exams become too costly or are proven to not be a right fit for Tennessee.


The purpose of testing should be to determine if a student is making satisfactory progress from grade to grade in grades 3 through 12. Our belief is that a standardized test is inappropriate within the K-2 setting. The use of assessments should allow educators to better assist students who are behind their peers to ensure they receive the help they need immediately to get back on track. In addition, those students who meet or exceed expectations can be monitored to make certain that they continue to excel. In the 9-12 setting, end-of-course (EOC) exams may still be an option if they are not discontinued. How many tests are needed? How often should they be administered? What is their purpose? These questions need to be asked frequently by stakeholders and policymakers.


The attraction of emergent technology is that it will allow educators to effectively identify and address student needs, if there is timely feedback. This ongoing transformation will continue to impact student learning – and advance prescriptive teaching. Students will need to demonstrate their mastery of knowledge or skills in a range of contexts. Assessments should allow educators to gauge their students more efficiently, and provide them with concise and accurate data to permit more focused support to students on an individual basis.


Most colleges and universities across the nation use the ACT, the SAT or both as part of their admissions procedure. The vast majority of state colleges and universities admit most of their applicants, and do not require minimum scores for admission that represent college readiness. A significant number of students require remediation. Is that a fault of the K-12 community or a failure by higher education? Perhaps greater dialogue and collaboration is needed. That is a discussion for another time.


The ACT test predicts a student’s prospect of earning credit in entry-level courses, but has not been aligned to states’ K-12 academic standards. This is also true of the SAT. The SAT is not designed to specifically predict college entry-level course success. However, it does provide predictors of overall college success, retention and completion. Both the ACT and SAT are in the process of fully developing their own suite of CCSS aligned assessments.


Stakeholders and policymakers all want what is best for public education. However, the road ahead is fraught with complexity. If we are going to take the time and expense to create standards, it stands to reason we will measure to see if students have in fact learned them. The purpose of testing is to guide educators on how and what to teach students so that education goals are met within a community, state and nation. We must keep focused on achieving our educational goals as a state and a nation.

For more on education policy and politics in Tennessee, follow us @TNEdReport